Last Updated on
TikTok is growing rapidly and shows no signs of slowing down. If you want to use TikTok for business, you need to know these TikTok stats.
The statistics below will help you make smart decisions about your social media marketing strategy, so you can get more likes on TikTok, get more followers on TikTok, and grow your business as a whole.
The stats covered are broken up by four different sections:
TikTok Demographic Stats
Let’s start by looking at the demographics of TikTok users because when planning a business marketing strategy, it’s essential your audience is on the platform you plan to use.
1. 58.8% of users on TikTok are female while 41.2% are male (Statista)
In the past, males accounted for more users than females, however, there are now more women/girls using TikTok. The split is fairly even, however, so businesses who target men will still benefit from posting content to TikTok.
2. 66% of users are under the age of 30 (App Ape Lab)
In the past, TikTok was thought of as being an app for the younger generation. And while that’s true, the age range of TikTok users is actually quite even, aside from the large segment of 19 and under.
Here’s a breakdown of TikTok demographics by age, according to App Ape Lab:
- 39.9% of users are aged 10-19
- 26.1% of users are aged 20-29
- 10.2% of users are aged 30-39
- 16.8% of users are aged 40-49
- 6.5% of users are aged 50+
A whopping 23.3% of TikTok users are over the age of 40, and if you target this demographic, you’ll certainly reach them through TikTok.
3. TikTok’s highest reach is women aged 18-24 (Marketing Charts)
With the growing number of women using TikTok and the majority of users under the age of 30, it’s no surprise that TikTok is ideal for those wanting to reach women aged 18-24.
4. 37% of US TikTok users have a household income of over $100,000 (Marketing Charts)
When broken down by household incomes (HHI), the largest segment of TikTok users have HHIs over six figures.
However, it’s worth noting that the second largest segment of users–18%–have HHIs of $25,000 or less.
TikTok Usage Stats
How do TikTok users behave? In this section, we’ll uncover some interesting stats on TikTok user behavior.
5. TikTok is available in over 150 countries (Xinhau Net)
Although countries like India have banned TikTok, TikTok is still available in exactly 155 countries.
India was a highly popular country for TikTok, with nearly 120 million users. Right now, TikTok is the most popular in China, with 400 million daily users.
6. 23% of online adults in the United States have seen a TikTok video (Statista)
When adults in America were asked if they had ever used or seen videos posted to TikTok, 23% responded yes, 44% with no, and 33% stated they had never heard of TikTok.
7. There are 26.5 million active monthly users from the United States (Media Kix)
The United States accounts for 3.3% of TikTok’s total active monthly users.
8. TikTok has around 800 million active monthly users (Data Reportal)
More than half of the world’s population (roughly 7.5 billion people) are on social media. This means that roughly 10.5% of the world’s popular is currently using TikTok.
9. TikTok is the seventh most used social media platform in the world, right behind Instagram (Data Reportal)
From most to least popular, the top 10 social platforms based on monthly active users are:
- Youtube
- Facebook Messenger
- TikTok
- Sina Weibo
- Qzone
10. TikTok users spend more time on the app per session than Instagram users
When a user opens TikTok, they spend more time, on average, than when they use Instagram.
TikTok users spend an average of 4.9 minutes per session on the app while Instagram users spend 3.1 minutes.
11. TikTok users spend an average of 52 minutes on the app every day (Business of Apps)
In the previous TikTok stat, we discussed how TikTok users spend more time per session on TikTok vs Instagram.
What’s interesting is that Instagram users spend 53 minutes on the app each day, while TikTok users spend 52 minutes. Instagram users spend less time per session but check Instagram more frequently than they check TikTok.
12. The average engagement rate on TikTok is 29% (Omnicore Agency)
Yes–you read that right! With an average engagement rate of 29%, TikTok blows other social media platforms out of the water, which possibly explains why so many people tend to get famous on TikTok.
For reference, the average Instagram engagement rate is 1.22%.
13. 54% of TikTok engagers left a comment on someone’s video (Global Web Index)
One TikTok stat you might take particular interest in is this one. Businesses and brands care about engagement and TikTok certainly delivers.
On the topic of being hyper-engaged, the behavior of those who engage on TikTok can be broken down by the following stats from Global Web Index:
- 68% watched someone else’s video
- 63% liked someone’s video
- 63% followed someone
- 59% opened the app without performing an action
- 55% uploaded a video
- 50% shared a video on a different social platform
- 43% uploaded a duet video
- 41% uploaded a react video
14. American users open the TikTok app 8 times per day (DigiDay)
TikTok users like to check in and don’t want to miss any of the action. In comparision, 63% of Instagram users open the Instagram app once per day.
As a business, you’ll have more chances to connect with your followers as they tend to log in more frequently.
15. 70% of TikTok users surveyed choose sounds for their videos based on their mood (Global Web Index)
As a musician, TikTok offers a unique way to promote music.
TikTok has the potential to explode the popularity of new songs and song snippets. Many sounds are made famous through TikTok and influencers are often paid to use specific songs in their videos.
16. TikTok users are most active in the morning (Influencer Marketing Hub)
The best time to post on TikTok is during the mornings in EST, but you should always experiment with your own account to see which posting time brings the highest level of engagement.
TikTok Revenue Stats
17. TikTok grossed $176.9 million in 2019 (TechCrunch)
As of today, TikTok’s total reported revenue is $247.6 million. To compare, in 2018, Instagram generated $6.84 billion. TikTok is growing rapidly and will only grow faster with paid advertising now offered to creators and businesses.
Random TikTok Stats
We’ve covered the essential TikTok stats you need to decide if you should start marketing your business on TikTok. Here’s an assortment of random TikTok stats to help you better understand the platform.
18. TikTok is banned in India
Tiktok has gotten off to a rough start with bannings and potential bannings from Japan and the United States. Countries state security concerns as the main reason why a ban is necessary.
19. Charli D’Amelio has the most followers on TikTok (Social Blade)
Charli D’Amelio–an American teenager–rose to fame this year on TikTok and currently has 89.9 million followers. The top 25 TikTok creators with the most followers all have over 25 million followers.
20. India’s TikTok ban cost the app 15 million users during the first ban (SensorTower)
Prior to India’s 2020 ban of TikTok, India had previously and unsuccessfully banned TikTok for a total of six days. During those six days, it is estimated that TikTok lost 15 million users.
21. TikTok’s website receives an estimated 1+ million visitors per day (Site Worth Traffic)
TikTok’s website is just as impressive as their app. According to Alexa, TikTok’s website is ranked #167 out of all websites and users view an average of 5.78 page views per day.
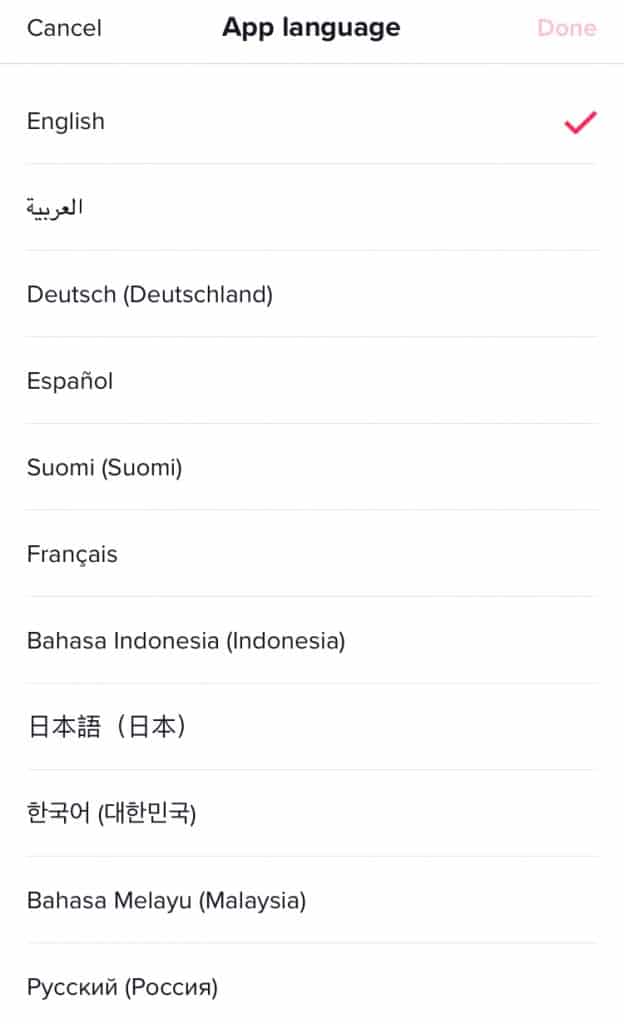
22. TikTok is available in 39 languages (TikTok)

23. The most widely used hashtag on TikTok is #tiktok
#tiktok currently has 1181.0 billion views and counting.
Summary
The above TikTok stats paint a promising picture for the future of TikTok for business owners. You can use these statistics to help you better understand the app and formulate a winning TikTok marketing strategy.
Pin me:

What TikTok statistic surprised you the most? Comment below.
This article may include affiliate links. As an Amazon Associate I earn from qualifying purchases.

Dana Nicole is an award-winning freelance writer for MarTech/SaaS who was rated one of the best SaaS writers by Software World. She specializes in writing engaging content that ranks high in search engines and has been featured in publications like Semrush, ConvertKit, and Hotjar.
Dana holds a Bachelor’s degree in Business Administration and has over 15 years of experience working alongside national brands in their marketing departments.
When Dana’s not working, you can find her dancing en pointe, cooking up new recipes, and exploring the great outdoors with her two big dogs.

